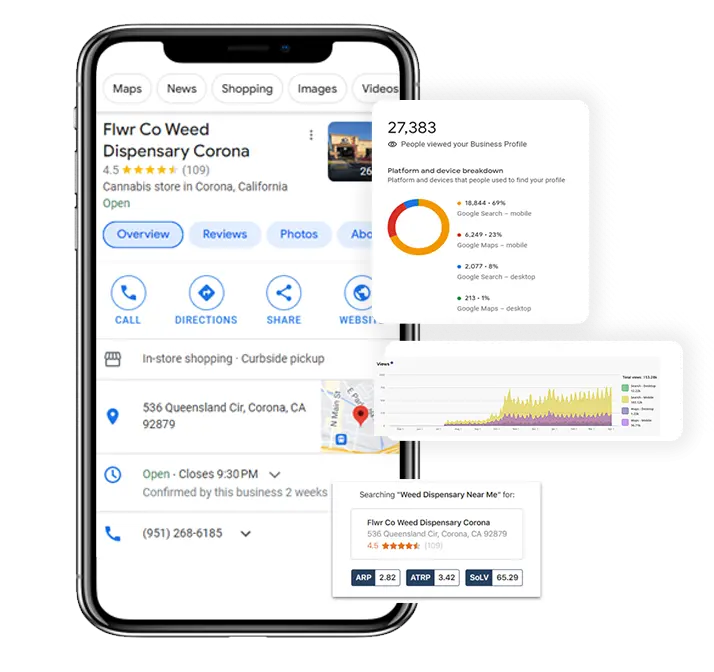
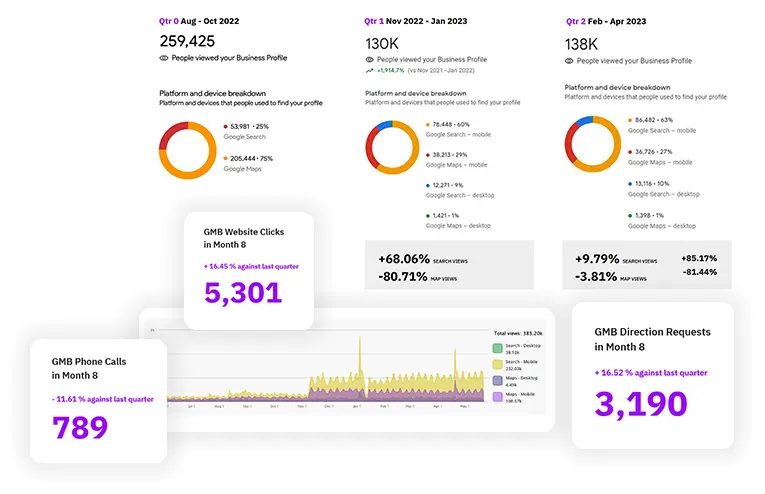
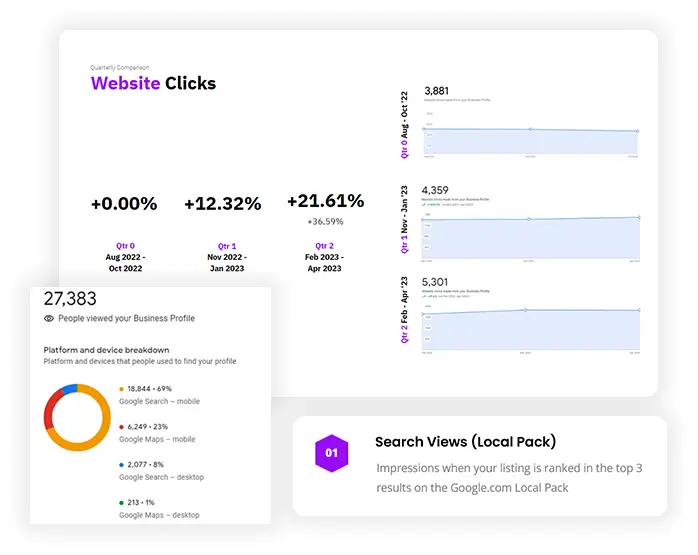
Our performance marketing reports focus on the key metrics that reflect the effectiveness of your marketing campaigns. We provide detailed data on various performance indicators such as website actions, including actions taken on your website such as form submissions, clicks, and purchases. We also track website visits, direction requests, and appearances on the Google top 3 map pack. These reports help you understand the impact of our strategies on driving engagement and attracting customers to your dispensary.
02
Search Performance Reports
We provide reports that measure the visibility and reach of your dispensary in search engine results. These reports include search impressions, which indicate how many times your dispensary appeared in search results. We also provide top 3 ranking reports, which show the keywords and phrases for which your dispensary ranks in the top 3 positions on search engines. These reports give you valuable insights into your dispensary's organic search performance and visibility..
03
Backlink Analysis Reports
Backlinks play a crucial role in improving your dispensary's online presence and search engine rankings. Our reports include an analysis of the backlinks pointing to your website. We track the number of backlinks, their quality, and their impact on your domain authority. These reports help you understand the effectiveness of our link building strategies and the overall authority of your website.
04
Website Traffic Reports
Our website traffic reports provide valuable insights into the number of visitors your website receives, the sources of traffic, and the behavior of your visitors. We track metrics such as total website visits, unique visitors, page views, and average session duration. These reports help you understand the effectiveness of your website in attracting and engaging visitors, allowing you to optimize your website's performance.
The problem: four dashboards and none of them agree
Most operators get their dispensary marketing reports in pieces. An agency deck of vanity numbers. The menu vendor's dashboard. The Google Business Profile insights screen. A spreadsheet someone on staff keeps. Each counts something different, over a different window, and none of them says what the marketing cost.
A report you can hold a vendor to has a named metric, a stated method, a window and a source screen. That is the standard below, and it is the same standard applied to every Dispenza case page: where one of the four is missing, the number is held rather than printed.
The other cost of stitched reporting is time. An owner who spends the first week of each month reconciling a deck against a dashboard is not spending it on the store. One report per location, on one day, ends that.
One report, three kinds of operator
Single location: one page, five numbers
Local rank for your keyword set, Share of Local Voice for “Dispensary Near Me”, website visits, calls, direction requests. One page, month over month, with the previous quarter beside it.
Multi-location and MSO: per-store roll-up
Every store gets its own page. The cover page rolls them up so you can see which store moved and which did not. Dispensary KPI reporting at the group level without losing the store-level cause. Built for the operators on the multi location dispensary SEO page.
Delivery: service-area visibility instead of a pin
A delivery operator does not rank on a storefront pin. The report measures visibility across the service area grid, so a “near me” gain in one zip code is not hidden by a loss in another. Order starts and completed orders from the menu-connected site sit beside the visibility numbers, because for a delivery operator the order is the walk-in.
Whichever shape you are, the report reads the same way: the number, how it was measured, the window, and the screen it came from.
What is in the report
The live report set, re-expressed in one measurement currency: Share of Local Voice (SoLV) for “Dispensary Near Me”, with the value's window and case page.
Performance marketing report:
Website actions (form submissions, clicks, purchases), website visits, direction requests and appearances in the Google top-3 map pack, set against what was spent. This is the cannabis marketing attribution section: which channel produced which action, in the same table as its cost.
Search performance report:
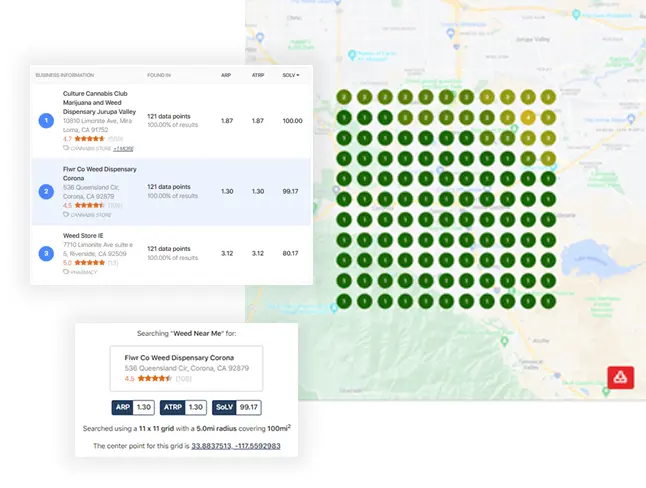
Search impressions, the keywords where the location holds a top-3 position, and the month's Share of Local Voice. SoLV is the share of the local pack you hold across a grid of points around the store for one keyword. A real value, with its window: +45.59% increase in SoLV for “Dispensary Near Me” over 6 months — NuLeaf NV case page.
Backlink analysis report:
Referring domains gained and lost, their quality band, and the effect on domain authority over the quarter. Link work becomes visible instead of assumed.
Website traffic report:
Total visits, unique visitors, page views, average session duration, traffic sources, and the menu pages that carried the orders. Pulled from the SGEN site we built, so there is no dispute over whose tag fired.
The FLWR Co page records the takeover of “Dispensary Near Me” over a 3-month window and its headline in as little as 30 days. The two tiles above are printed as they appear on that page.
SoLV values on this page come only from a named case page. We do not print benchmarks we cannot source.
What this replaces
A rank-tracker subscription, a separate analytics agency, and the manual monthly deck. The reporting module is in the plan, runs on the site and profile we manage, and lands on the same day each month.
What the report contains is set out above, and every number in it can be checked against the named case pages.
Share of Local Voice (SoLV) is the share of the local pack a location holds for one keyword, measured across a grid of points around the store rather than from a single pin. We report it monthly for “Dispensary Near Me” with the window stated. Example: +45.59% increase in SoLV for “Dispensary Near Me” over 6 months — NuLeaf NV case page.
How often do we get reports?
Monthly, with a quarterly review that sets the next quarter's targets. The module is named Monthly + Quarterly Advanced Reporting & Attribution on the plan plate and is included in both plans. The report lands on the same day each month, one per location, and the quarterly review is a call with your dedicated campaign strategist.
Can we see every location in one view?
Yes. Each location gets its own page and the cover rolls every store into one table: rank, SoLV, visits, calls, direction requests and spend, side by side. Multi-state operators see the same layout per state. The store page is always one click from the roll-up, so a group-level change can be traced to the store that caused it.
Do you report ad spend and returns?
Yes. The performance marketing report puts spend beside the actions it produced: website actions, visits, calls and direction requests, by channel. That is the attribution half of the module name. We report what our own tags and the platforms record; we do not model or estimate returns we cannot see.
Book the demo
Reporting is a named module in both plans. Pricing is scoped to your locations; every module in both plans is listed in full — how pricing works.